Atlantic City: Built Infrastructure Assets Exposure Snapshot
Introduction
Data Last Updated: 2022-07-20 14:23:59
 Built infrastructure (i.e., wastewater treatment facilities, energy generation locations, bridges, evacuation routes and rail lines)
may be in areas that flood now, or are expected to flood in the future.
It is important to understand the exposure of built infrastructure since communities and
their residents rely on the services these infrastructure sources provide.
Knowing the services provided by built infrastructure will help a community plan for flooding.
Built infrastructure (i.e., wastewater treatment facilities, energy generation locations, bridges, evacuation routes and rail lines)
may be in areas that flood now, or are expected to flood in the future.
It is important to understand the exposure of built infrastructure since communities and
their residents rely on the services these infrastructure sources provide.
Knowing the services provided by built infrastructure will help a community plan for flooding.
There are 3 types of flood events:
- Riverine (or ‘fluvial’) flood events occur when intense rain events cause rivers and streams to overtop their banks.
- Flash (or ‘pluvial’) floods occur when intense rainfall causes a flood event that is not directly associated with a body of water. For example, flash flood events include floods in roadways from impaired stormwater management systems.
- Coastal flood events occur when sea-level rise, high tides, and storm surge combine to create flood events that range from nuisance high-tide floods to destructive storm tides from seawater.
The Federal Emergency Management Agency (FEMA) models flood hazards, both riverine (1) and coastal (3), as part of the National Flood Insurance Program (NFIP) regulations and insurance requirements. FEMA does not model flash flood events (2) for their NFIP flood mapping.
In addition, coastal flood event exposures are assessed using a Total Water Level (TWL) approach for tidally influenced waters. The TWL approach combines sea-level rise and extreme water level information from NOAA to assess exposure to a variety of coastal flood events to complement FEMA flood mapping.
Atlantic City: Built Infrastructure Assets Exposure Snapshot
Built Infrastructure Assets in Exposed Areas
| Assets | Total Assets | # Exposed at 2ft TWL | # Exposed at 5ft TWL | # Exposed at 7ft TWL |
|---|---|---|---|---|
| Wastewater | 1 | 0 | 0 | 0 |
| Energy Generation | 4 | 0 | N/A | 3 |
| Power Plants | 1 | 0 | 0 | 0 |
| NJ Bridges* | 31 | 5 | 10 | 20 |
| Gas Stations | 9 | 0 | 6 | 8 |
- * The National Bridge Inventory is a collection of information (database) describing the more than 600,000 of the Nation's bridges located on public roads as of December 31, 2018, including Interstate Highways, U.S. highways, State and county roads, as well as publicly-accessible bridges on Federal lands. It presents a State by State summary analysis of the number, location, and general condition of highway bridges within each State.
Atlantic City: Built Infrastructure Assets Exposure Snapshot
Built Infrastructure Assets in FEMA Flood Zone Areas
| Total Assets | # Exposed in ... | ||
|---|---|---|---|
| Assets | 1% Annual Chance Flood | 0.2% Annual Chance Flood | |
| Wastewater | 1 | 0 | 0 |
| Energy Generation | 4 | 2 | 3 |
| Power Plants | 1 | 0 | 0 |
| NJ Bridges* | 31 | 22 | 23 |
| Gas Stations | 9 | 8 | 9 |
* The National Bridge Inventory is a collection of information (database) describing the more than 600,000 of the Nation's bridges located on public roads as of December 31, 2018, including Interstate Highways, U.S. highways, State and county roads, as well as publicly-accessible bridges on Federal lands. It presents a State by State summary analysis of the number, location, and general condition of highway bridges within each State.
The FEMA National Flood Hazard Layer (NFHL) dataset represents the current effective flood data across the United States. Areas in the National Flood Hazard Layer are:
- Floodway: The floodway is the channel of a stream plus any adjacent floodplain areas that must be kept free of encroachment so that the 1% annual chance flood can be carried without substantial increases in flood height.
- 1% Annual Chance Flood: The 1% annual flood (100-year flood), also known as the base flood, is the flood that has a 1% chance of being equaled or exceeded in any given year. The Special Flood Hazard Area is the area subject to flooding by the 1% annual chance flood. Areas of Special Flood Hazard include Zones A, AE, AH, AO, AR, A99, V, and VE. The Base Flood Elevation is that water-surface elevation of the 1% annual chance flood.
- 0.2% Annual Chance Flood: The 0.2% annual flood (500-year flood) is the flood that has a 0.2% chance of being equaled or exceeded in any given year.
- Areas of Undetermined Flood Hazard are areas with possible but undetermined flood hazards.
- FEMA Flood Zone exposure analyses are inclusive of lesser FEMA flood designations. The number exposed to 1% Annual Chance Flood includes those exposed in the Regulatory Floodway area in its analysis and the 0.2% Annual Chance Flood includes those exposed in the 1% Annual Change Flood and in the Regulatory Floodway.
Atlantic City: Built Infrastructure Assets Exposure Snapshot
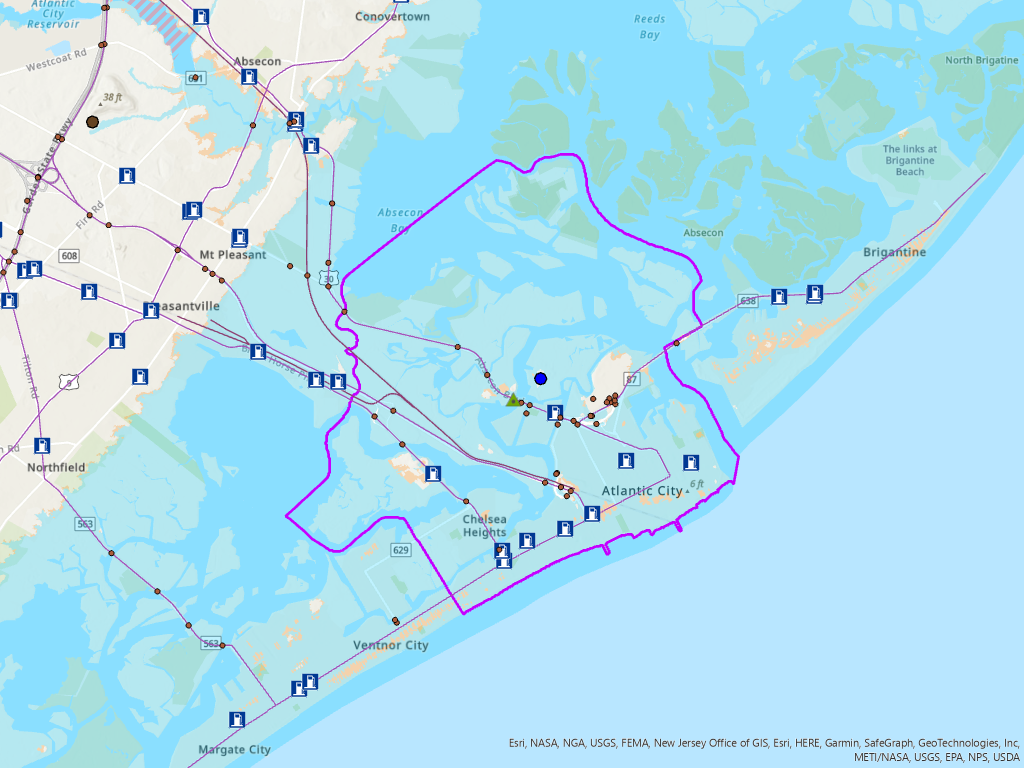
Atlantic City: Built Infrastructure Assets Exposure Snapshot
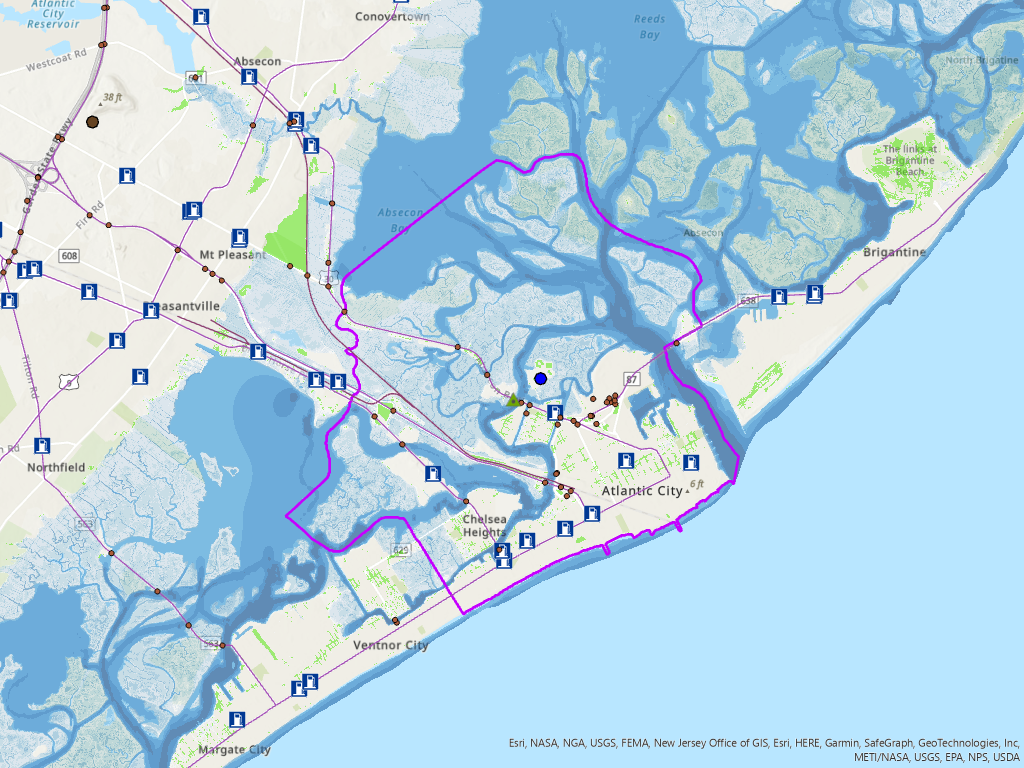
2 ft. Exposed
A 2-foot flood event along the New Jersey coast today can occur because of a coastal storm or especially high tide. By 2050, the same 2-foot flood event may happen during daily high tide alone because of sea-level rise. While daily high tides will result in flood inundation for parts of every day, coastal storm-induced flood events last only for the duration of a storm (although their impacts could be felt for far longer). Built infrastructure assets with exposures to a 2-foot flood event should consider short-term impacts from temporary inundation due to a storm, and longer-term impacts from permanent inundation when waters may not recede.
Atlantic City: Built Infrastructure Assets Exposure Snapshot
Atlantic City: Built Infrastructure Assets Exposure Snapshot
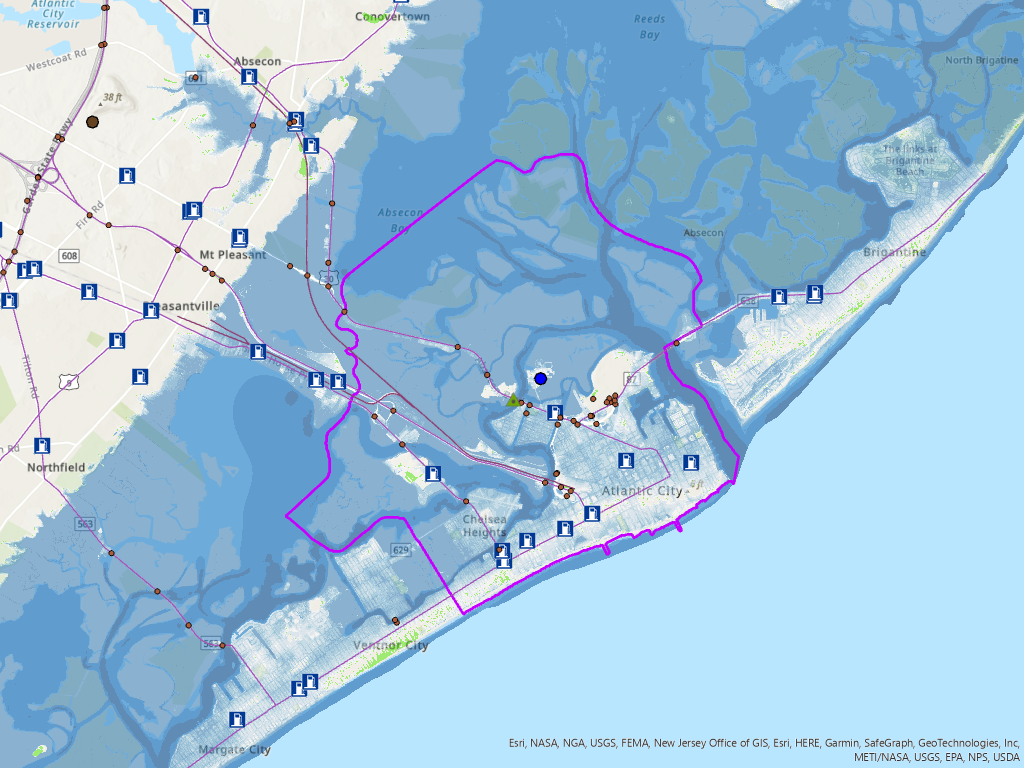
7 ft. Exposed
A 7-foot flood event along the New Jersey coast today can occur from a combination of coastal storm surge (hurricane or nor’easter) on top of a rising mean sea level. In the future, a 7-foot flood event along the New Jersey coast would become more likely to occur as the mean sea-level rises. For built infrastructure assets it is important to be aware of and plan for currently “low probability, high consequence” flood events whose probability of occurring will become greater as sea-levels rise. Built infrastructure assets with exposures to a 7-foot flood event should consider short-term impacts from temporary inundation due to a storm, and longer-term impacts from the increasing probability that such an event could occur as sea-levels rise.
Atlantic City: Built Infrastructure Assets Exposure Snapshot
Legend
NJ Political Boundaries
FRS Wastewater Treatment Plants
National Bridge Inventory
Environmental NJEMS - Gas Stations
Hurricane Evacuation Routes
North American Rail Lines
Utilities - Power Plants (NJ)
Primary Source
EPA Coastal Energy Facilities
Type
FEMA Flood Zones
Flood Hazard Areas
Atlantic City: Built Infrastructure Assets Exposure Snapshot
Appendix: Background Information Regarding the Total Water Level Approach
This Appendix provides additional background on sea-level rise and the Total Water Level approach for assessing vulnerability of people, places, and assets in New Jersey to sea-level rise and sea-level rise combined with storm events.
Sea level Rise and Total Water Level: From 1911 to 2019, the mean sea-level rose 1.5 feet along the New Jersey coast, compared to a 0.6 feet rise in the global mean sea-level. New Jersey coastal areas are likely to experience sea-level rise of 0.5 to 1.1 feet between 2000 and 2030, and 0.9 to 2.1 feet between 2000 and 2050.

Figure A-1. Total Water Level reflecting combined inundation from future sea-level rise and flood events.
The number of days that New Jersey residents have experienced high-tide floods has also increased. From 2007 through 2016, there was an average of 8 high-tide flood events in Atlantic City each year. Based on the likely range of sea-level rise projections, Atlantic City will experience 17-75 days of expected high-tide flooding per year in 2030, and 45-255 days per year of expected high-tide flooding in 2050.
For the purposes of the exposure snapshots, different flood events are defined by total water levels (TWLs). TWLs present a height above high tide (See Figure A-1) that reflects the combined inundation from future sea-level rise and current flood events projected into the future from the year 2000 (Kopp et al., 2019).
Flood events1 can occur from surge created by a coastal storm (such as a hurricane or nor’easter) or from high tide each day as sea levels rise. For example, a 2-foot flood event along the New Jersey coast today can occur because of seasonal ‘high-tide flood’ conditions. By 2050, the same 2-foot flood events will become more frequent, occurring under normal high-tide conditions and inundating the affected areas2. While flood events resulting from daily tides will result in permanent inundation (i.e., the water will not recede), coastal storm induced flood events last only for the duration of a storm. A 7-foot flood event along the New Jersey coast that approximates potential hurricane storm tides today will become more likely in the future as coastal storm surge occurs on top of an increased baseline of sea-level to create higher storm tides. You can use our tools at (NJADAPT / NJFLOODMAPPER) to develop custom water levels for your region.
1Flood events referenced in this document as examples reflect ‘total water level’ heights above Year 2000 Mean Higher High Water, consistent with the sea-level baseline datum. See Kopp et al., 2019.
2See Kopp et al., 2019 Appendix B for region specific high-tide flood frequency projections.
Metadata / Sources - Flood Hazards
| Where to Get It | |||
|---|---|---|---|
| Name | Description | Map Service | Authoritative Source |
| FEMA Flood Zones | This FIRM data service allows users to view FIRMs for NJ. Counties were combined using the data downloaded from FEMA's Region II office. | FEMA Flood Zones Map Service | Federal Emergency Management Agency(FEMA) |
| Total Water Level (0 - 20 ft) | This dataset illustrates the scale of potential flooding, not the exact location, and does not account for erosion, subsidence, or future construction. Inundation is shown as it would appear during the highest high tides (excludes wind driven tides). The dataset should be used only as a screening-level tool for management decisions. As with all remotely sensed data, all features should be verified with a site visit. | Total Water Level Map Service | |
| Sea Level Rise (0 - 10 ft.) | This dataset was created as part of the National Oceanic and Atmospheric Administration Office for Coastal Management's efforts to depict potential sea level rise and its associated impacts on the nation's coastal areas. The purpose of the mapping viewer is to provide coastal managers and scientists with a preliminary look at sea level rise and coastal flooding impacts. The purpose of this dataset is to show potential sea level rise inundation above current Mean Higher High Water (MHHW) for the area.This dataset illustrates the scale of potential flooding, not the exact location, and does not account for erosion, subsidence, or future construction. Inundation is shown as it would appear during the highest high tides (excludes wind driven tides) with the sea level rise amount. The dataset should be used only as a screening-level tool for management decisions. | Sea Level Rise Map Services | NOAA Office for Coastal Management |
| SLR Mapping Confidence (0 - 10 ft.) | Inundation Uncertainty Associated with Elevation Data and Tidal Datum Conversion for Sea Level Rise. The purpose of this dataset is to depict errors that are directly related to elevation and water height data. These errors can be used to begin defining areas with mapped inundation that do not have the same level of confidence as other areas. For a detailed explanation of mapping methods, see https://meridian.allenpress.com/jcr/article-abstract/30/3/548/202407/Mapping-and-Portraying-Inundation-Uncertainty-of?redirectedFrom=fulltext | SLR Mapping Confidence Map Services | NOAA Office for Coastal Management |
Metadata / Sources - Infrastructure
| Where to Get It | |||
|---|---|---|---|
| Name | Description | Map Service | Authoritative Source |
| Wastewater Treatment Plants | This dataset combines facility data from US EPA's Facility Registry Service (FRS) and Integrated Compliance Information System (ICIS) for wastewater treatment plants. This dataset combines FRS facility data and derived attributes with ICIS wastewater treatment data, and has been presented to display Publicly Owned Treatment Works and Federal facilities. | Wastewater Treatment Plants Map Service | United States Environmental Protection Agency |
| Energy Generation Facilities | This feature layer, utilizing data from the U.S. Environmental Protection Agency (EPA), displays coastal energy facilities that generate electricity in the U.S. The locations are created from the Environmental Protection Agency Emissions & Generation Resource Integrated Database (eGRID). Only facilities adjacent to the coast and Great Lakes are shown. Contained within the data are records that define the fuel source and other characteristics of the facility. In some cases, the presence of a facility may indicate that certain power transmission infrastructure exists nearby. | Energy Generation Facilities Map Service | United States Environmental Protection Agency |
| Mobile Home Parks | The Mobile Home Parks feature class/shapefile contains locations that represent mobile home, residential trailer, and recreational vehicle (RV) parks within the Continental United States and Alaska. The people residing in these housing types are the most vulnerable residential population to hurricanes, tornadoes, flooding and other natural disasters. This feature class/shapefile captures mobile home park locations (to include recreational vehicle (RV) parks) for the Homeland Infrastructure Foundation Level Data (HIFLD) database. | Mobile Home Parks Map Service | Office of Homeland Security - Homeland Infrastructure Foundation-Level Data (HIFLD) Working Group |
| Child Care Centers | This data is a graphical representation of the listing of licensed active child care centers in NJ. It was created for the State of New Jersey's initiative regarding child care centers near contaminated sites. As of the April 2017 child care center GIS layer revision, non-profit child care centers found in Public Schools (NIPS) are also included in this GIS layer even though they are not required to submit environmental data to the NJDEP for NJDCF licensing. Proposed child care centers are not listed until a NJDCF License number is issued. | Child Care Centers Map Service | New Jersey Department of Environmental Protection (NJDEP) |
| Power Plants of New Jersey | This dataset shows all of the electric generation stations, power plants, above 1 Megawatt capacity in New Jersey, which includes both fossil and renewable energy sources. | Power Plants of New Jersey Map Service | NJDEP Bureau of Energy & Sustainability |