Freehold Township: Built Infrastructure Assets Exposure Snapshot
Introduction
Data Last Updated: 2022-07-21 10:27:14
 Built infrastructure (i.e., wastewater treatment facilities, energy generation locations, bridges, evacuation routes and rail lines)
may be in areas that flood now, or are expected to flood in the future.
It is important to understand the exposure of built infrastructure since communities and
their residents rely on the services these infrastructure sources provide.
Knowing the services provided by built infrastructure will help a community plan for flooding.
Built infrastructure (i.e., wastewater treatment facilities, energy generation locations, bridges, evacuation routes and rail lines)
may be in areas that flood now, or are expected to flood in the future.
It is important to understand the exposure of built infrastructure since communities and
their residents rely on the services these infrastructure sources provide.
Knowing the services provided by built infrastructure will help a community plan for flooding.
There are 3 types of flood events:
- Riverine (or ‘fluvial’) flood events occur when intense rain events cause rivers and streams to overtop their banks.
- Flash (or ‘pluvial’) floods occur when intense rainfall causes a flood event that is not directly associated with a body of water. For example, flash flood events include floods in roadways from impaired stormwater management systems.
- Coastal flood events occur when sea-level rise, high tides, and storm surge combine to create flood events that range from nuisance high-tide floods to destructive storm tides from seawater.
The Federal Emergency Management Agency (FEMA) models flood hazards, both riverine (1) and coastal (3), as part of the National Flood Insurance Program (NFIP) regulations and insurance requirements. FEMA does not model flash flood events (2) for their NFIP flood mapping.
Freehold Township: Built Infrastructure Assets Exposure Snapshot
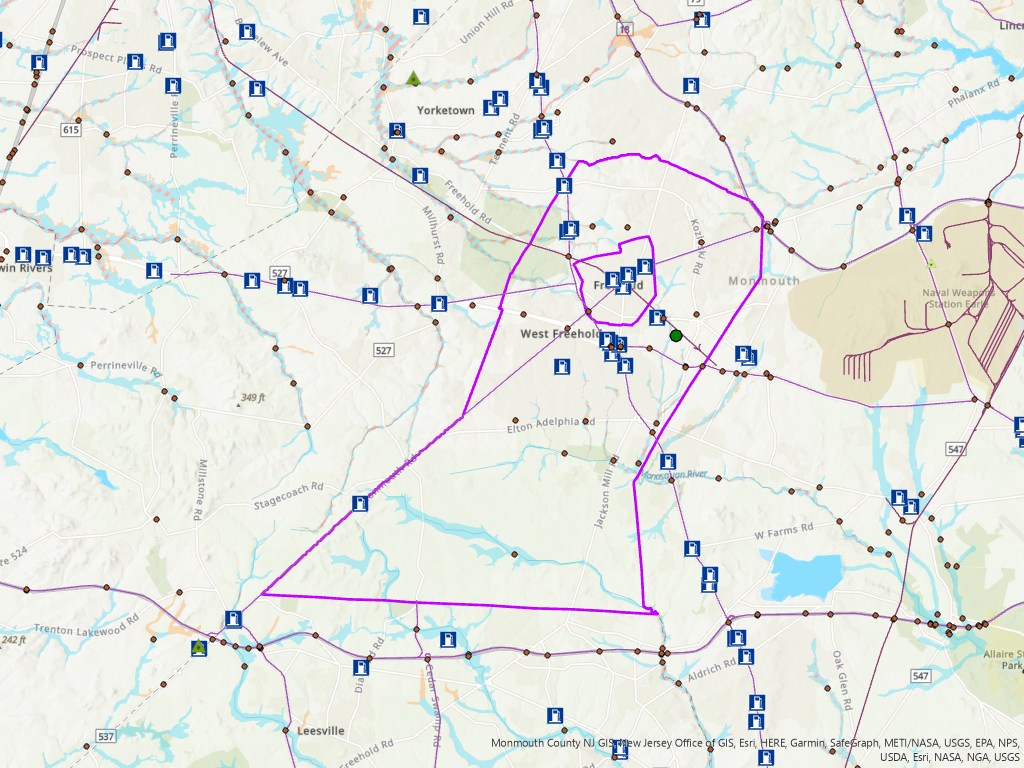
Built Infrastructure Assets in FEMA Flood Zone Areas
| Total Assets | # Exposed in ... | |||
|---|---|---|---|---|
| Assets | 1% Annual Chance Flood | 0.2% Annual Chance Flood | Regulatory Floodway | |
| Wastewater | 0 | 0 | 0 | 0 |
| Energy Generation | 3 | 0 | 0 | 0 |
| Power Plants | 1 | 0 | 0 | 0 |
| NJ Bridges* | 24 | 4 | 6 | 3 |
| Gas Stations | 11 | 0 | 0 | 0 |
* The National Bridge Inventory is a collection of information (database) describing the more than 600,000 of the Nation's bridges located on public roads as of December 31, 2018, including Interstate Highways, U.S. highways, State and county roads, as well as publicly-accessible bridges on Federal lands. It presents a State by State summary analysis of the number, location, and general condition of highway bridges within each State.
The FEMA National Flood Hazard Layer (NFHL) dataset represents the current effective flood data across the United States. Areas in the National Flood Hazard Layer are:
- Floodway: The floodway is the channel of a stream plus any adjacent floodplain areas that must be kept free of encroachment so that the 1% annual chance flood can be carried without substantial increases in flood height.
- 1% Annual Chance Flood: The 1% annual flood (100-year flood), also known as the base flood, is the flood that has a 1% chance of being equaled or exceeded in any given year. The Special Flood Hazard Area is the area subject to flooding by the 1% annual chance flood. Areas of Special Flood Hazard include Zones A, AE, AH, AO, AR, A99, V, and VE. The Base Flood Elevation is that water-surface elevation of the 1% annual chance flood.
- 0.2% Annual Chance Flood: The 0.2% annual flood (500-year flood) is the flood that has a 0.2% chance of being equaled or exceeded in any given year.
- Areas of Undetermined Flood Hazard are areas with possible but undetermined flood hazards.
- FEMA Flood Zone exposure analyses are inclusive of lesser FEMA flood designations. The number exposed to 1% Annual Chance Flood includes those exposed in the Regulatory Floodway area in its analysis and the 0.2% Annual Chance Flood includes those exposed in the 1% Annual Change Flood and in the Regulatory Floodway.
Freehold Township: Built Infrastructure Assets Exposure Snapshot
Freehold Township: Built Infrastructure Assets Exposure Snapshot
Legend
NJ Political Boundaries
FRS Wastewater Treatment Plants
National Bridge Inventory
Environmental NJEMS - Gas Stations
Hurricane Evacuation Routes
North American Rail Lines
Utilities - Power Plants (NJ)
Primary Source
EPA Coastal Energy Facilities
Type
FEMA Flood Zones
Flood Hazard Areas
Metadata / Sources - Flood Hazards
| Where to Get It | |||
|---|---|---|---|
| Name | Description | Map Service | Authoritative Source |
| FEMA Flood Zones | This FIRM data service allows users to view FIRMs for NJ. Counties were combined using the data downloaded from FEMA's Region II office. | FEMA Flood Zones Map Service | Federal Emergency Management Agency(FEMA) |
Metadata / Sources - Infrastructure
| Where to Get It | |||
|---|---|---|---|
| Name | Description | Map Service | Authoritative Source |
| Wastewater Treatment Plants | This dataset combines facility data from US EPA's Facility Registry Service (FRS) and Integrated Compliance Information System (ICIS) for wastewater treatment plants. This dataset combines FRS facility data and derived attributes with ICIS wastewater treatment data, and has been presented to display Publicly Owned Treatment Works and Federal facilities. | Wastewater Treatment Plants Map Service | United States Environmental Protection Agency |
| Energy Generation Facilities | This feature layer, utilizing data from the U.S. Environmental Protection Agency (EPA), displays coastal energy facilities that generate electricity in the U.S. The locations are created from the Environmental Protection Agency Emissions & Generation Resource Integrated Database (eGRID). Only facilities adjacent to the coast and Great Lakes are shown. Contained within the data are records that define the fuel source and other characteristics of the facility. In some cases, the presence of a facility may indicate that certain power transmission infrastructure exists nearby. | Energy Generation Facilities Map Service | United States Environmental Protection Agency |
| Mobile Home Parks | The Mobile Home Parks feature class/shapefile contains locations that represent mobile home, residential trailer, and recreational vehicle (RV) parks within the Continental United States and Alaska. The people residing in these housing types are the most vulnerable residential population to hurricanes, tornadoes, flooding and other natural disasters. This feature class/shapefile captures mobile home park locations (to include recreational vehicle (RV) parks) for the Homeland Infrastructure Foundation Level Data (HIFLD) database. | Mobile Home Parks Map Service | Office of Homeland Security - Homeland Infrastructure Foundation-Level Data (HIFLD) Working Group |
| Child Care Centers | This data is a graphical representation of the listing of licensed active child care centers in NJ. It was created for the State of New Jersey's initiative regarding child care centers near contaminated sites. As of the April 2017 child care center GIS layer revision, non-profit child care centers found in Public Schools (NIPS) are also included in this GIS layer even though they are not required to submit environmental data to the NJDEP for NJDCF licensing. Proposed child care centers are not listed until a NJDCF License number is issued. | Child Care Centers Map Service | New Jersey Department of Environmental Protection (NJDEP) |
| Power Plants of New Jersey | This dataset shows all of the electric generation stations, power plants, above 1 Megawatt capacity in New Jersey, which includes both fossil and renewable energy sources. | Power Plants of New Jersey Map Service | NJDEP Bureau of Energy & Sustainability |