New Jersey: Natural and Working Lands Exposure Snapshot
Introduction
Data Last Updated: 2022-08-29 14:08:58
 Natural and working lands include wetlands, open space, beaches and dunes, agricultural lands and forests.
These lands provide various economic and ecosystem service values including production agriculture for food, timber, and horticultural purposes;
habitat; recreation; flood protection; recharge and filtration; and sequestration of carbon.
Wetlands, are tidal or nontidal areas where water covers the soil and is present at or near the soil surface all year or for varying periods of time.
Wetlands are important for flood protection, nurseries for fisheries and habitat for wildlife.
Wetlands also filter and trap pollutants and excess nutrients from water runoff associated with impervious surfaces and therefore,
critical for water quality. Coastal wetlands help protect coastal areas by absorbing wave energy and reducing flooding and erosion.
Understanding where natural and working lands are in relation to climate-related hazards can help a community plan for impacts to these critical resources.
Natural and working lands include wetlands, open space, beaches and dunes, agricultural lands and forests.
These lands provide various economic and ecosystem service values including production agriculture for food, timber, and horticultural purposes;
habitat; recreation; flood protection; recharge and filtration; and sequestration of carbon.
Wetlands, are tidal or nontidal areas where water covers the soil and is present at or near the soil surface all year or for varying periods of time.
Wetlands are important for flood protection, nurseries for fisheries and habitat for wildlife.
Wetlands also filter and trap pollutants and excess nutrients from water runoff associated with impervious surfaces and therefore,
critical for water quality. Coastal wetlands help protect coastal areas by absorbing wave energy and reducing flooding and erosion.
Understanding where natural and working lands are in relation to climate-related hazards can help a community plan for impacts to these critical resources.
There are 3 types of flood events:
- Riverine (or ‘fluvial’) flood events occur when intense rain events cause rivers and streams to overtop their banks.
- Flash (or ‘pluvial’) floods occur when intense rainfall causes a flood event that is not directly associated with a body of water. For example, flash flood events include floods in roadways from impaired stormwater management systems.
- Coastal flood events occur when sea-level rise, high tides, and storm surge combine to create flood events that range from nuisance high-tide floods to destructive storm tides from seawater.
The Federal Emergency Management Agency (FEMA) models flood hazards, both riverine (1) and coastal (3), as part of the National Flood Insurance Program (NFIP) regulations and insurance requirements. FEMA does not model flash flood events (2) for their NFIP flood mapping.
In addition, coastal flood event exposures are assessed using a Total Water Level (TWL) approach for tidally influenced waters. The TWL approach combines sea-level rise and extreme water level information from NOAA to assess exposure to a variety of coastal flood events to complement FEMA flood mapping.
New Jersey: Natural and Working Lands Exposure Snapshot
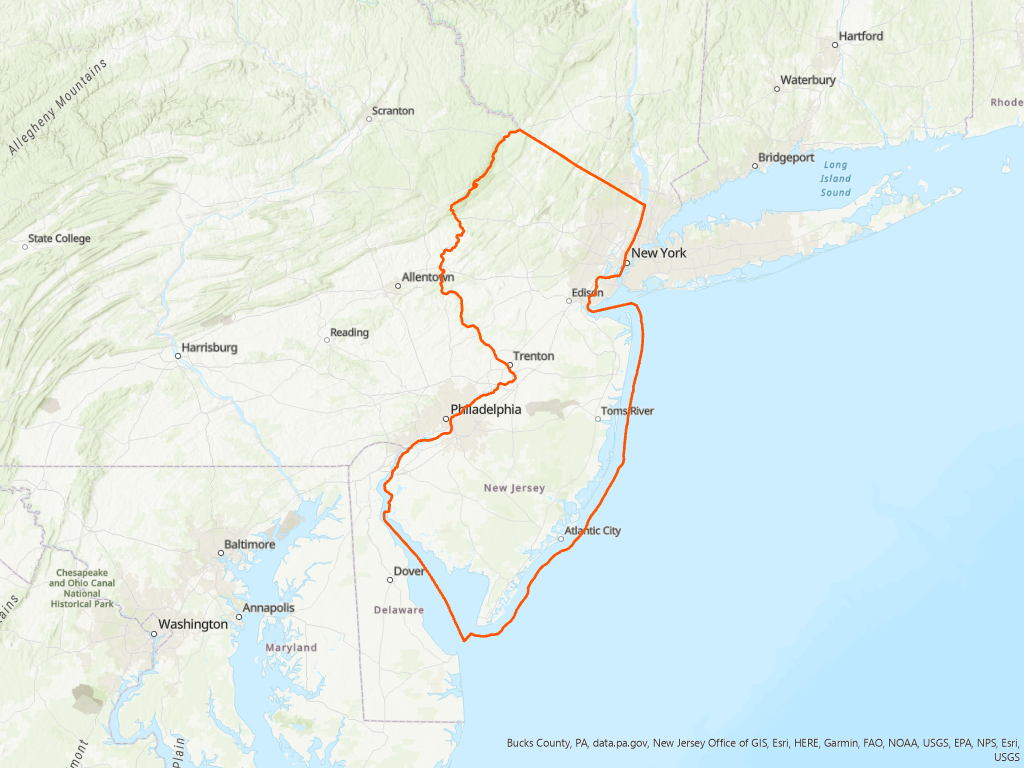
Natural and Working Lands in Exposed Areas
Total Acres In State: 5,550,448
| Assets | Total Acres of Natural and Working Land Types | Acres Exposed at 2ft TWL | Acres Exposed at 5ft TWL | Acres Exposed at 7ft TWL |
|---|---|---|---|---|
| Wetlands (Interior) | 696,074 | 41,787 | 71,415 | 87,309 |
| Open Space | 1,432,147 | 167,440 | 190,139 | 202,541 |
| Beaches And Dunes | 8,015 | 1,843 | 4,116 | 5,294 |
| Agricultural Lands | 529,101 | 3,401 | 9,752 | 14,146 |
| Forest | 1,516,696 | 6,406 | 15,901 | 22,915 |
New Jersey: Natural and Working Lands Exposure Snapshot
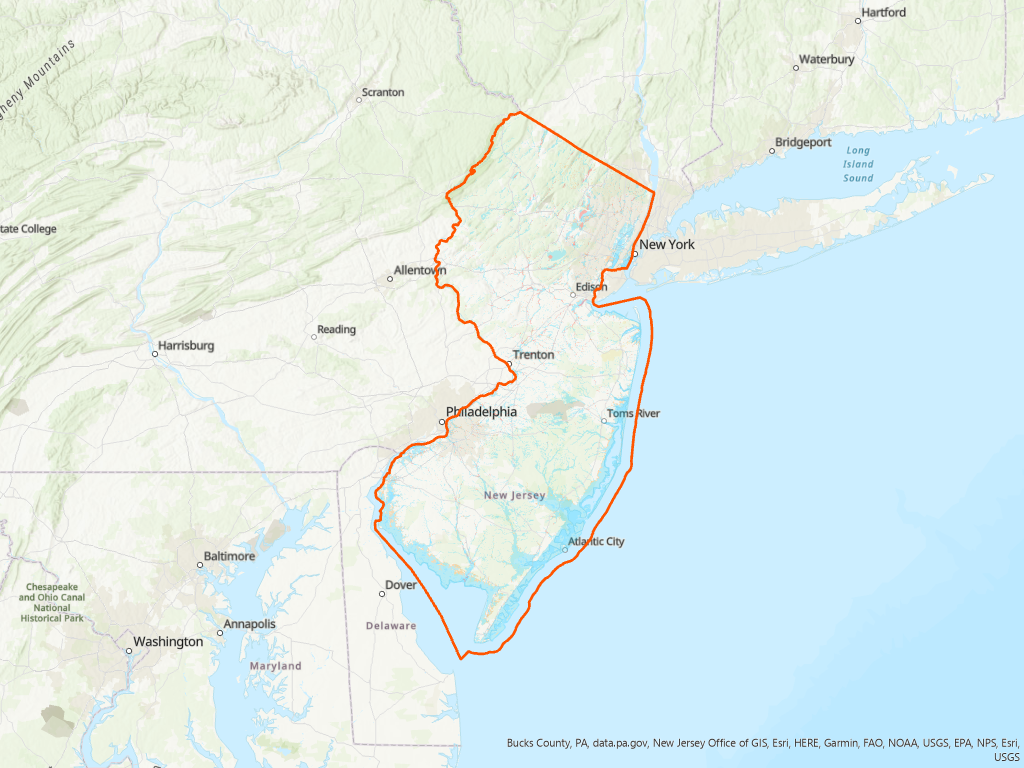
Natural and Working Lands in FEMA Flood Zone Areas
Total Acres In State: 5,550,448
| Assets | Total Acres of Natural and Working Land Types | Acres Exposed in 1% Annual Chance Flood | Acres Exposed in 0.2% Annual Chance Flood | Acres Exposed in Regulatory Floodway | Acres Exposed in Area of Undetermined Flood Hazard |
|---|---|---|---|---|---|
| Wetlands (Interior) | 696,074 | 281,323 | 307,299 | 42,502 | 4,849 |
| Open Space | 1,432,147 | 389,657 | 410,210 | 38,467 | 12,298 |
| Beaches And Dunes | 8,015 | 6,826 | 7,098 | 1 | 842 |
| Agricultural Lands | 529,101 | 16,679 | 25,657 | 2,616 | 1 |
| Forest | 1,516,696 | 65,107 | 79,738 | 9,459 | 5,732 |
The FEMA National Flood Hazard Layer (NFHL) dataset represents the current effective flood data across the United States. Areas in the National Flood Hazard Layer are:
- Floodway: The floodway is the channel of a stream plus any adjacent floodplain areas that must be kept free of encroachment so that the 1% annual chance flood can be carried without substantial increases in flood height.
- 1% Annual Chance Flood: The 1% annual flood (100-year flood), also known as the base flood, is the flood that has a 1% chance of being equaled or exceeded in any given year. The Special Flood Hazard Area is the area subject to flooding by the 1% annual chance flood. Areas of Special Flood Hazard include Zones A, AE, AH, AO, AR, A99, V, and VE. The Base Flood Elevation is that water-surface elevation of the 1% annual chance flood.
- 0.2% Annual Chance Flood: The 0.2% annual flood (500-year flood) is the flood that has a 0.2% chance of being equaled or exceeded in any given year.
- Areas of Undetermined Flood Hazard are areas with possible but undetermined flood hazards.
- FEMA Flood Zone exposure analyses are inclusive of lesser FEMA flood designations. The number exposed to 1% Annual Chance Flood includes those exposed in the Regulatory Floodway area in its analysis and the 0.2% Annual Chance Flood includes those exposed in the 1% Annual Change Flood and in the Regulatory Floodway.
New Jersey: Natural and Working Lands Exposure Snapshot
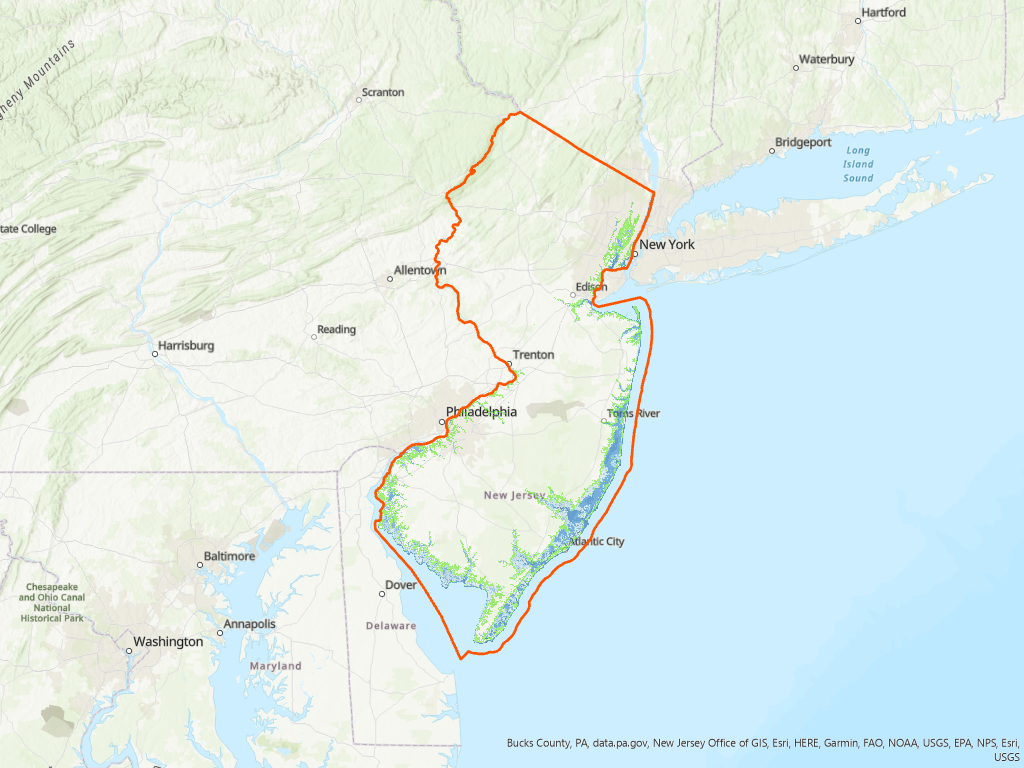
Marsh Erosion and Wetland Retreat
Marsh Erosion
Sea level rise and coastal storms have increased the amount of coastal salt marsh shoreline erosion. These erosive edges are in addition to the drowning of marshes due to increased inundation by saltwater.
- Shoreline Erosion (1977 - 2012): 5,896 Acres
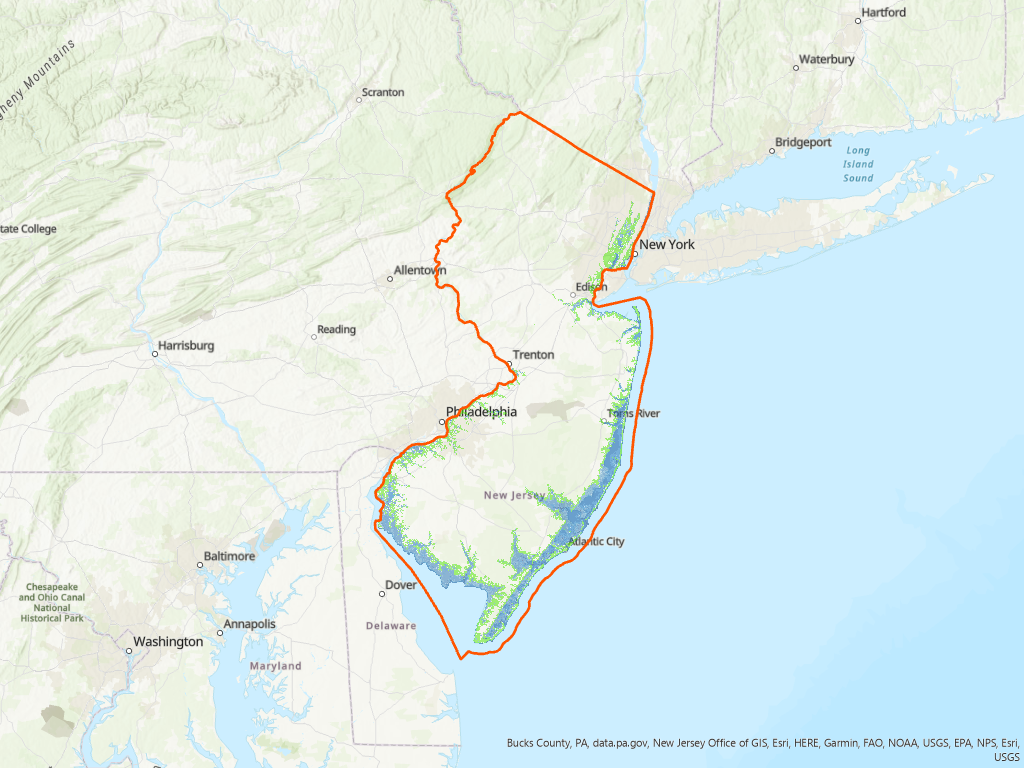
Marsh Loss and Retreat
If coastal wetlands become permanently inundated by tidal water due to sea level rise, they can drown and no longer provide their beneficial natural functions. If they are able to “keep pace” with sea level rise, they will move from their original location by migrating landward. This is known as marsh retreat. This type of marsh retreat is only possible if the marshes are unimpeded from migrating. Impediments can be hardened structures like bulkheads, roads, revetments, etc.
Total Marsh Area Analyzed (2 ft SLR): 278,256 Acres
Marsh Retreat
- Unimpeded Marsh, Able to Retreat: 51,570 Acres
- Impeded Marsh, Unable to Retreat: 4,668 Acres
Marsh Conversion
- Marsh Conversion to Mudflat: 59,785 Acres
- Marsh conversion to open water: 17,604 Acres
- Freshwater tidal marsh conversion to salt marsh: 5,860 Acres
Unaffected
- Unaffected Tidal Marsh: 138,767 Acres
New Jersey: Natural and Working Lands Exposure Snapshot
Access Points
Access Points In Exposed Areas
Along the NJ coastline, sea-level rise and coastal storms impact public access points that are important areas for recreation. Public access points are locations that provide a means of allowing the public to access the state’s tidal waterways. These maps show the locations of public access points in relation to 2-foot and 7-foot flood events.
| Access Point | Total Access Points | Access Points Exposed at 2 ft. | Access Points Exposed at 5 ft. | Access Points Exposed at 7 ft. |
|---|---|---|---|---|
| All Access Points | 3,927 | 946 | 2,099 | 2,645 |
Access Points In FEMA Flood Zone Areas
Along the NJ coastline, sea-level rise and coastal storms impact public access points that are important areas for recreation. Public access points are locations that provide a means of allowing the public to access the state’s tidal waterways. These maps show the locations of public access points in relation to flood hazards.
| # Exposed in ... | |||||
|---|---|---|---|---|---|
| Access Point | Total Access Points | 1% Annual Chance Flood | 0.2% Annual Chance Flood | Regulatory Floodway | |
| All Access Points | 3,927 | 3,364 | 3,587 | 139 | |
New Jersey: Natural and Working Lands Exposure Snapshot
New Jersey: Natural and Working Lands Exposure Snapshot
New Jersey: Natural and Working Lands Exposure Snapshot
New Jersey: Natural and Working Lands Exposure Snapshot
New Jersey: Natural and Working Lands Exposure Snapshot
Legend
NJ Political Boundaries
NJDEP Tidal and Shoreline Public Access


Marsh Edge Erosion

FEMA Flood Zones
Flood Hazard Areas
New Jersey: Built Infrastructure Assets Exposure Snapshot
Appendix: Background Information Regarding the Total Water Level Approach
This Appendix provides additional background on sea-level rise and the Total Water Level approach for assessing vulnerability of people, places, and assets in New Jersey to sea-level rise and sea-level rise combined with storm events.
Sea level Rise and Total Water Level: From 1911 to 2019, the mean sea-level rose 1.5 feet along the New Jersey coast, compared to a 0.6 feet rise in the global mean sea-level. New Jersey coastal areas are likely to experience sea-level rise of 0.5 to 1.1 feet between 2000 and 2030, and 0.9 to 2.1 feet between 2000 and 2050.

Figure A-1. Total Water Level reflecting combined inundation from future sea-level rise and flood events.
The number of days that New Jersey residents have experienced high-tide floods has also increased. From 2007 through 2016, there was an average of 8 high-tide flood events in Atlantic City each year. Based on the likely range of sea-level rise projections, Atlantic City will experience 17-75 days of expected high-tide flooding per year in 2030, and 45-255 days per year of expected high-tide flooding in 2050.
For the purposes of the exposure snapshots, different flood events are defined by total water levels (TWLs). TWLs present a height above high tide (See Figure A-1) that reflects the combined inundation from future sea-level rise and current flood events projected into the future from the year 2000 (Kopp et al., 2019).
Flood events1 can occur from surge created by a coastal storm (such as a hurricane or nor’easter) or from high tide each day as sea levels rise. For example, a 2-foot flood event along the New Jersey coast today can occur because of seasonal ‘high-tide flood’ conditions. By 2050, the same 2-foot flood events will become more frequent, occurring under normal high-tide conditions and inundating the affected areas2. While flood events resulting from daily tides will result in permanent inundation (i.e., the water will not recede), coastal storm induced flood events last only for the duration of a storm. A 7-foot flood event along the New Jersey coast that approximates potential hurricane storm tides today will become more likely in the future as coastal storm surge occurs on top of an increased baseline of sea-level to create higher storm tides. You can use our tools at (NJADAPT / NJFLOODMAPPER) to develop custom water levels for your region.
1Flood events referenced in this document as examples reflect ‘total water level’ heights above Year 2000 Mean Higher High Water, consistent with the sea-level baseline datum. See Kopp et al., 2019.
2See Kopp et al., 2019 Appendix B for region specific high-tide flood frequency projections.
Metadata / Sources - Flood Hazards
| Where to Get It | |||
|---|---|---|---|
| Name | Description | Map Service | Authoritative Source |
| FEMA Flood Zones | This FIRM data service allows users to view FIRMs for NJ. Counties were combined using the data downloaded from FEMA's Region II office. | FEMA Flood Zones Map Service | Federal Emergency Management Agency(FEMA) |
| Total Water Level (0 - 20 ft) | This dataset illustrates the scale of potential flooding, not the exact location, and does not account for erosion, subsidence, or future construction. Inundation is shown as it would appear during the highest high tides (excludes wind driven tides). The dataset should be used only as a screening-level tool for management decisions. As with all remotely sensed data, all features should be verified with a site visit. | Total Water Level Map Service | |
| Sea Level Rise (0 - 10 ft.) | This dataset was created as part of the National Oceanic and Atmospheric Administration Office for Coastal Management's efforts to depict potential sea level rise and its associated impacts on the nation's coastal areas. The purpose of the mapping viewer is to provide coastal managers and scientists with a preliminary look at sea level rise and coastal flooding impacts. The purpose of this dataset is to show potential sea level rise inundation above current Mean Higher High Water (MHHW) for the area.This dataset illustrates the scale of potential flooding, not the exact location, and does not account for erosion, subsidence, or future construction. Inundation is shown as it would appear during the highest high tides (excludes wind driven tides) with the sea level rise amount. The dataset should be used only as a screening-level tool for management decisions. | Sea Level Rise Map Services | NOAA Office for Coastal Management |
| SLR Mapping Confidence (0 - 10 ft.) | Inundation Uncertainty Associated with Elevation Data and Tidal Datum Conversion for Sea Level Rise. The purpose of this dataset is to depict errors that are directly related to elevation and water height data. These errors can be used to begin defining areas with mapped inundation that do not have the same level of confidence as other areas. For a detailed explanation of mapping methods, see https://meridian.allenpress.com/jcr/article-abstract/30/3/548/202407/Mapping-and-Portraying-Inundation-Uncertainty-of?redirectedFrom=fulltext | SLR Mapping Confidence Map Services | NOAA Office for Coastal Management |
Metadata / Sources - Marsh and Open Space
| Where to Get It | |||
|---|---|---|---|
| Name | Description | Map Service | Authoritative Source |
| Tidal Marsh | This data layer represents New Jersey tidal marshes. The data were extracted from the NJDEP 2012 Land Use/Land Cover GIS dataset (http://www.state.nj.us/dep/gis/lulc12.html), then further edited by the Center for Remote Sensing and Spatial Analysis (CRSSA), Rutgers University, using 2017 high resolution National Agricultural Imagery Program (NAIP) digital orthophotography for the purposes of the marsh impact/marsh retreat zone modeling and analysis. The data are gridded at a spatial resolution of 10 ft or 3+ m grid cell size. | Tidal Marsh Map Service | Rutger University Center for Remote Sensing and Spatial Analysis |
| Open Space | NJ Open Space, compiled from a county, state and federal sources. | Open Space Map Service | Rutger University Center for Remote Sensing and Spatial Analysis |
| Marsh Retreat Combined | Tidal marsh retreat, showing baseline and likelihood of conversion for 1-3 ft. sea level rise | Tidal Marsh Retreat Map Service | Rutger University Center for Remote Sensing and Spatial Analysis |
| Marsh Retreat SLR 1 ft. | Tidal marsh retreat, showing baseline and likelihood of conversion for 1 ft. sea level rise | Tidal Marsh Retreat Map Service | Rutger University Center for Remote Sensing and Spatial Analysis |
| Marsh Retreat SLR 2 ft. | Tidal marsh retreat, showing baseline and likelihood of conversion for 2 ft. sea level rise | Tidal Marsh Retreat Map Service | Rutger University Center for Remote Sensing and Spatial Analysis |
| Marsh Retreat SLR 3 ft. | Tidal marsh retreat, showing baseline and likelihood of conversion for 3 ft. sea level rise | Tidal Marsh Retreat Map Service | Rutger University Center for Remote Sensing and Spatial Analysis |
Metadata / Sources - Access Points
| Where to Get It | |||
|---|---|---|---|
| Name | Description | Map Service | Authoritative Source |
| Tidal Water Public Access | The public's right to access tidal waters and their shorelines is a concept that existed prior to the inception of the State of New Jersey and continues to this day. Staff works with municipal governments to develop voluntary Municipal Public Access Plans consistent with the Coastal Permit Program (N.J.A.C. 7:7) and Coastal Zone Management rules (N.J.A.C. 7:7E) in an effort develop Municipal Public Access Plans to enhance public access to tidal waters in a comprehensive manner. This layer represents an inventory of public access points that has been collected to date. As additional public access plans and inventories are developed this layer will be updated. | Tidal Water Public Access Map Service | New Jersey Department of Environmental Protection (NJDEP) |
Metadata / Sources - Land Use Land Cover
| Where to Get It | |||
|---|---|---|---|
| Name | Description | Map Service | Authoritative Source |
| Land Use / Land Cover 2015 | This present 2015 update was created by comparing the 2012 LU/LC layer from NJDEP's Geographic Information Systems (GIS) database to 2015 color infrared (CIR) imagery and delineating and coding areas of change. Custom symbology for this dataset was created by the Rutgers Office of Research Analytics (http://ora.rutgers.edu) | Land Use / Land Cover Map Service | New Jersey Department of Environmental Protection |