New Jersey: Public Health Exposure Snapshot
Introduction
Data Last Updated: 2023-09-25 08:12:08
 Increasing temperatures, heavier rain events, and the increasing frequency and severity of flood events driven by sea-level rise present numerous impacts to public health that will continue to intensify, while new health threats are emerging.
Health impacts from these various climate-related exposures may include:
- Increased respiratory disease;
- Increased cardiovascular disease;
- Injuries;
- Premature deaths related to extreme weather events (e.g, heat-related deaths; drowning-related fatalities);
- Food- and waterborne illnesses; and
- Mental health impacts (e.g., stress, anxiety and fear).
This public health municipal snapshot is a focused area of development for the Rutgers team. An initial set of data regarding temperature and flood exposure is presented while the Rutgers team is currently actively seeking additional sets of data that can support efforts to advance climate change and public health efforts at the state, regional and local levels.
There are 3 types of flood events:
- Riverine (or ‘fluvial’) flood events occur when intense rain events cause rivers and streams to overtop their banks.
- Flash (or ‘pluvial’) floods occur when intense rainfall causes a flood event that is not directly associated with a body of water. For example, flash flood events include floods in roadways from impaired stormwater management systems.
- Coastal flood events occur when sea-level rise, high tides, and storm surge combine to create flood events that range from nuisance high-tide floods to destructive storm tides from seawater.
The Federal Emergency Management Agency (FEMA) models flood hazards, both riverine (1) and coastal (3), as part of the National Flood Insurance Program (NFIP) regulations and insurance requirements. FEMA does not model flash flood events (2) for their NFIP flood mapping.
In addition, coastal flood event exposures are assessed using a Total Water Level (TWL) approach for tidally influenced waters. The TWL approach combines sea-level rise and extreme water level information from NOAA to assess exposure to a variety of coastal flood events to complement FEMA flood mapping.
New Jersey: Public Health Exposure Snapshot
Projected Climate Data
| Baseline | Moderate Emissions (RCP 4.5)1 Change from Baseline |
High Emissions (RCP 8.5)1 Change from Baseline |
|||||
|---|---|---|---|---|---|---|---|
| Year | 1981-2010 | 2030 | 2060 | 2090 | 2030 | 2060 | 2090 |
| Days Above 95°F (Days)2 | 0 to 10 | 0 to +20 | 0 to +20 | 0 to +30 | 0 to +20 | 0 to +40 | +11 to +60 |
| Cooling Degree Days (Degree Days)3 | 0 to 1600 | +200 to +400 | +200 to +800 | +400 to +800 | +200 to +600 | +400 to +1000 | +1000 to +1600 |
| Max Temp. July (°F)4 | 76°F to 90°F | +1°F to +4°F | +3°F to +5°F | +3°F to +6°F | +1°F to +4°F | +4°F to +8°F | +6°F to +12°F |
- 1 Representative Concentration Pathway (RCP) is a greenhouse gas concentration trajectory adopted by the IPCC, which describes different climate futures, all of which are considered possible depending on how much greenhouse gases are emitted in the years to come. Emissions in RCP 4.5 peak around 2040, then decline. In RCP 8.5, emissions continue to rise throughout the 21st century.
- 2 The total number of days per year with maximum temperature above 95°F is an indicator of how often very hot conditions occur. Depending upon humidity, wind, and access to air-conditioning, humans may feel very uncomfortable or experience heat stress or other heat-related illness on very hot days. Hot days also stress plants and animals as well as infrastructure. Increased demand for cooling can stress energy infrastructure. A baseline is compiled from a long-term average of observations for a particular variable. In this case the baseline for the number of days per year in NJ with maximum temperature above 95°F was created over a 30-year period from 1981 to 2010.
- 3 The number of cooling degree days per year reflects the amount of energy people use to cool buildings during the warm season. For this calcluation a standard base temperature of 65°F is utilized. On a day when the average outdoor temperature is 85°F, reducing the indoor temperature by 20 degrees over 1 day requires 20 degrees of cooling multiplied by 1 day, or 20 cooling degree days. Utility companies use cooling degree days to estimate the annual amount of energy people will use to cool buildings. A baseline is compiled from a long-term average of observations for a particular variable. In this case the baseline for the change in the number of cooling degree days during the warm season in NJ was created over a 30-year period from 1981 to 2010.
- 4 The change in maximum July temperature reflects how this temperature will change under moderate and high emission scenarios by 2030, 2060, and 2090. A change in the maximum July temperature, historically the hottest month of the year in NJ, could cause temperatures to exceed thresholds of comfort, increasing the chances of heat related illnesses, energy demand, and deleterious impacts on plants and animals. A baseline is compiled from a long-term average of observations for a particular variable. In this case the baseline for change in maximum July temperature was created over a 30-year period from 1981 to 2010.
Climate data provided by the Northeast Regional Climate Center at Cornell University through their Applied Climate Information System (ACIS, rcc-acis.org). The Localized Constructed Analog downscaling projections were obtained from the Scripps Institution of Oceanography (http://loca.ucsd.edu).
New Jersey: Public Health Exposure Snapshot
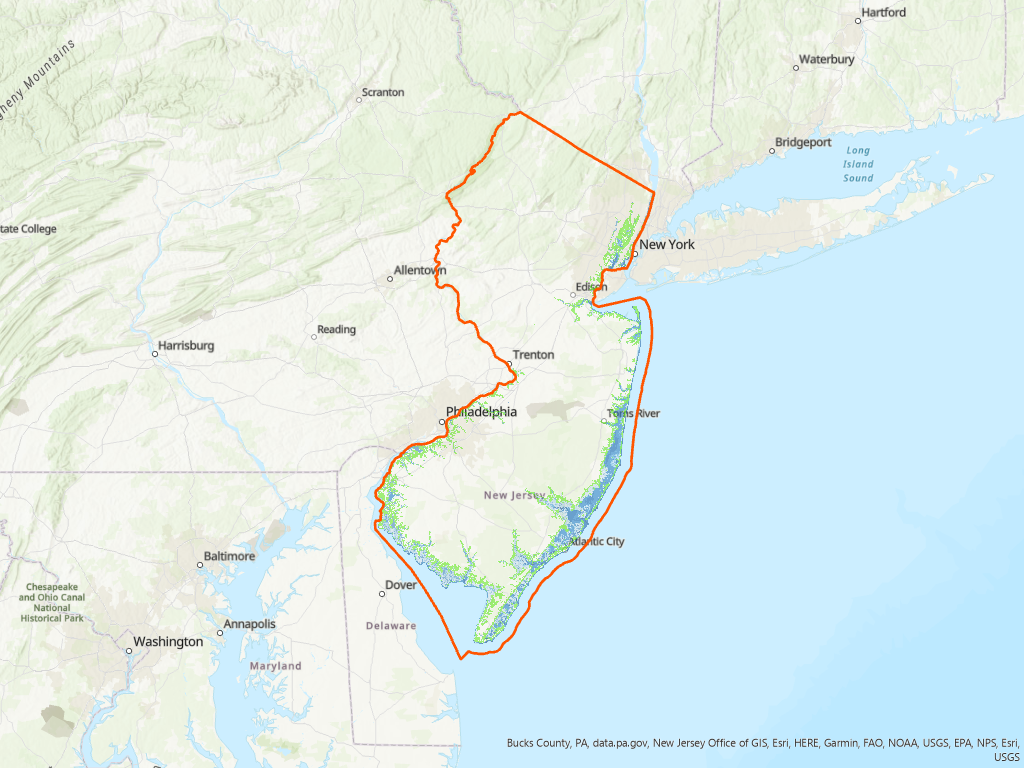
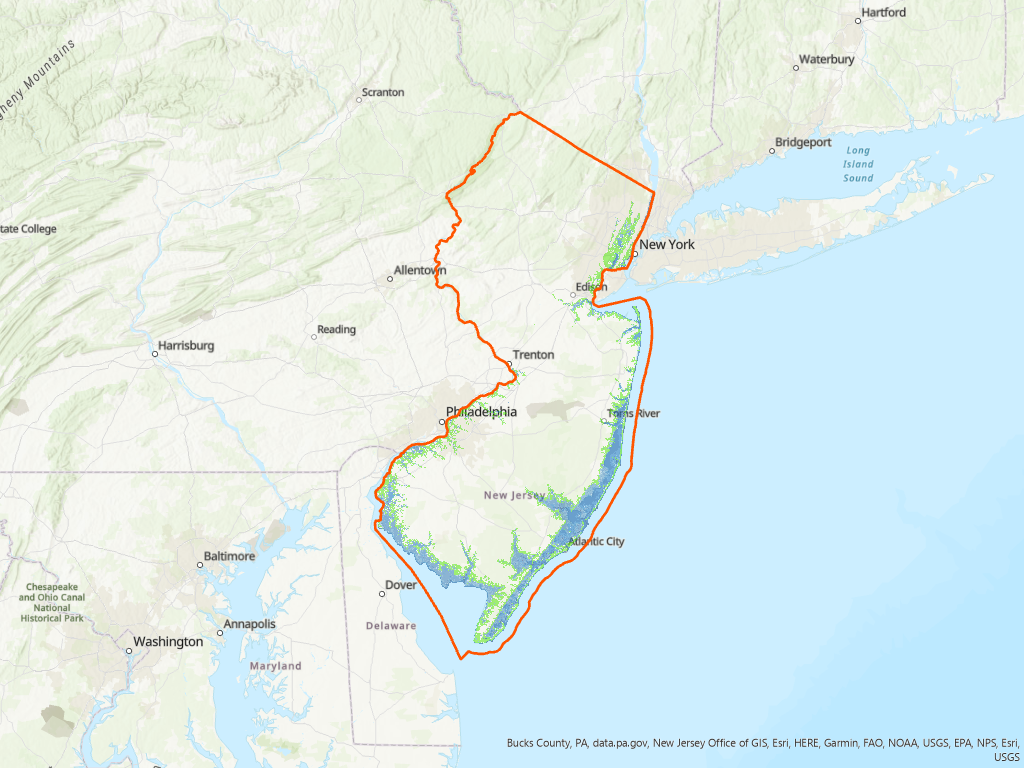
Health Related Sites in Exposed Areas
| Assets | Total Assets | # Exposed at 2ft TWL | # Exposed at 5ft TWL | # Exposed at 7ft TWL |
|---|---|---|---|---|
| Hospitals | 153 | 0 | 2 | 6 |
| Nursing Homes / Assisted Care | 153 | 0 | 2 | 6 |
| Known Contaminated Sites | 13,482 | 253 | 1,282 | 1,976 |
| EPA Superfund Sites | 1,606 | 39 | 171 | 247 |
New Jersey: Public Health Exposure Snapshot
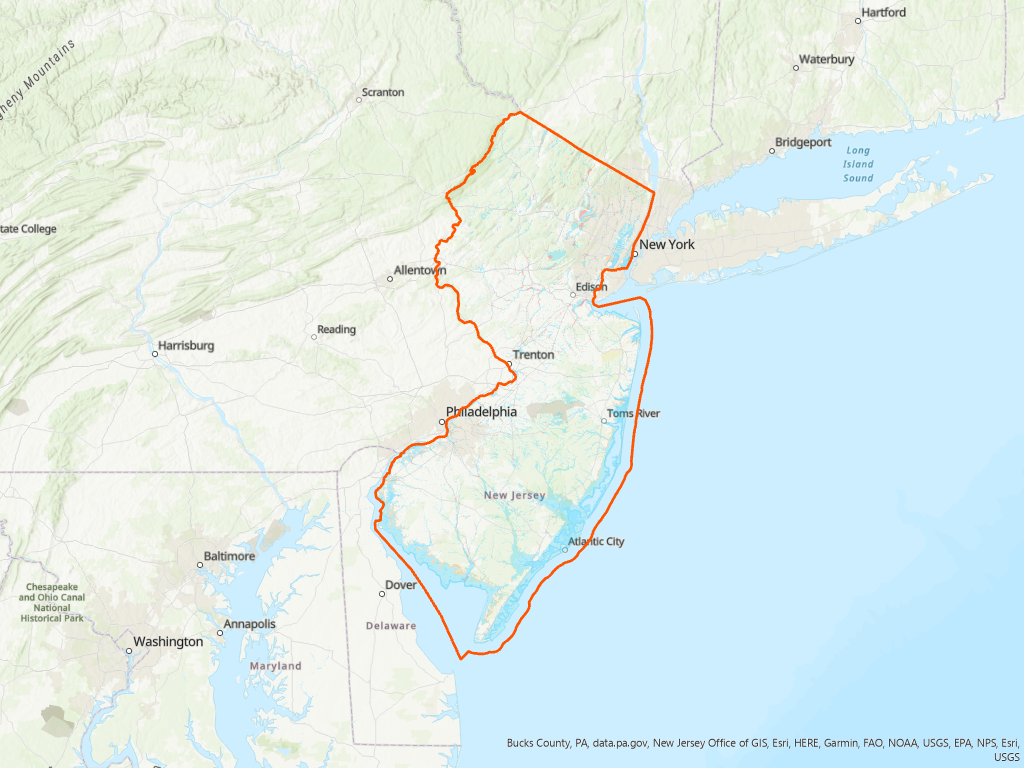
Health Related Sites in FEMA Flood Zone Areas
| Total Assets | # Exposed in ... | ||||
|---|---|---|---|---|---|
| Assets | 1% Annual Chance Flood | 0.2% Annual Chance Flood | Regulatory Floodway | Area of Undetermined Flood Hazard | |
| Hospitals | 153 | 9 | 13 | 0 | 0 |
| Nursing Homes / Assisted Care | 153 | 9 | 13 | 0 | 0 |
| Known Contaminated Sites | 13,482 | 2,271 | 2,942 | 99 | 8 |
| EPA Superfund Sites | 1,606 | 289 | 390 | 22 | 2 |
The FEMA National Flood Hazard Layer (NFHL) dataset represents the current effective flood data across the United States. Areas in the National Flood Hazard Layer are:
- Floodway: The floodway is the channel of a stream plus any adjacent floodplain areas that must be kept free of encroachment so that the 1% annual chance flood can be carried without substantial increases in flood height.
- 1% Annual Chance Flood: The 1% annual flood (100-year flood), also known as the base flood, is the flood that has a 1% chance of being equaled or exceeded in any given year. The Special Flood Hazard Area is the area subject to flooding by the 1% annual chance flood. Areas of Special Flood Hazard include Zones A, AE, AH, AO, AR, A99, V, and VE. The Base Flood Elevation is that water-surface elevation of the 1% annual chance flood.
- 0.2% Annual Chance Flood: The 0.2% annual flood (500-year flood) is the flood that has a 0.2% chance of being equaled or exceeded in any given year.
- Areas of Undetermined Flood Hazard are areas with possible but undetermined flood hazards.
- FEMA Flood Zone exposure analyses are inclusive of lesser FEMA flood designations. The number exposed to 1% Annual Chance Flood includes those exposed in the Regulatory Floodway area in its analysis and the 0.2% Annual Chance Flood includes those exposed in the 1% Annual Change Flood and in the Regulatory Floodway.
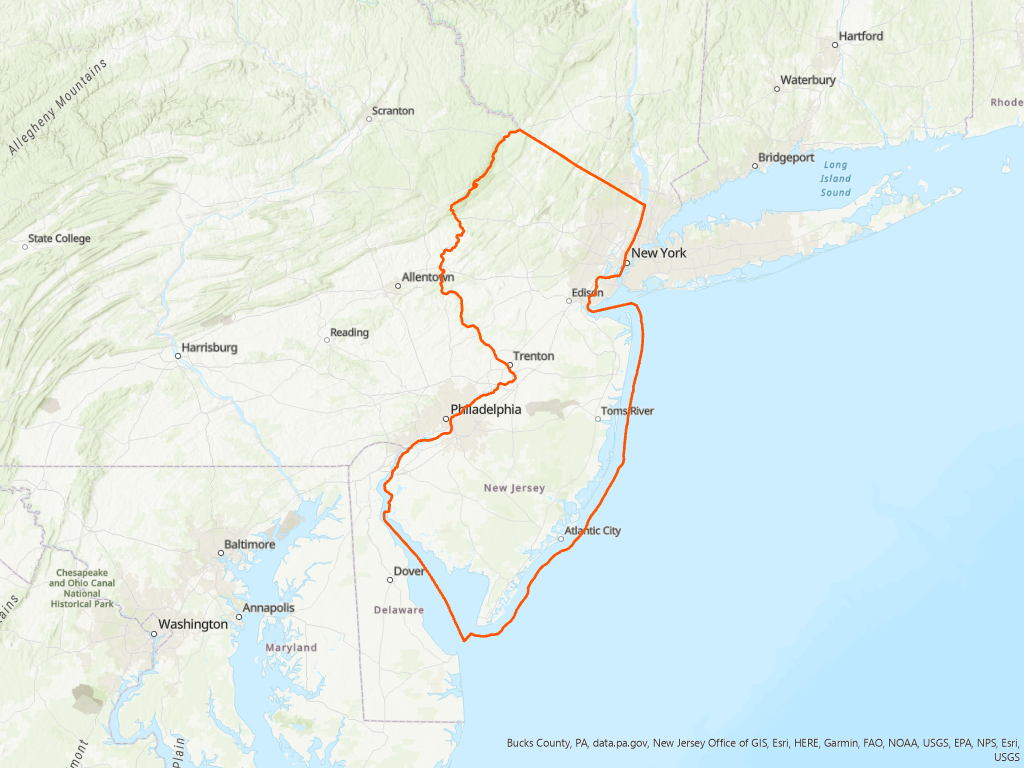
New Jersey: Public Health Exposure Snapshot
Vulnerable Population Report
While all people living in the United States are affected by climate change, some communities and some populations are more vulnerable to changing climate conditions and related health impacts than others. Extensive research here in the United States and across the world points to populations of concern including those that are low-income, communities of color, immigrant populations, people with limited English proficiency, Indigenous people, older and younger adults, people with disabilities and compromised health and mental health conditions, and others.
Link to Vulnerable Population ReportNew Jersey: Public Health Exposure Snapshot
New Jersey: Public Health Exposure Snapshot
New Jersey: Public Health Exposure Snapshot
New Jersey: Public Health Exposure Snapshot
New Jersey: Public Health Exposure Snapshot
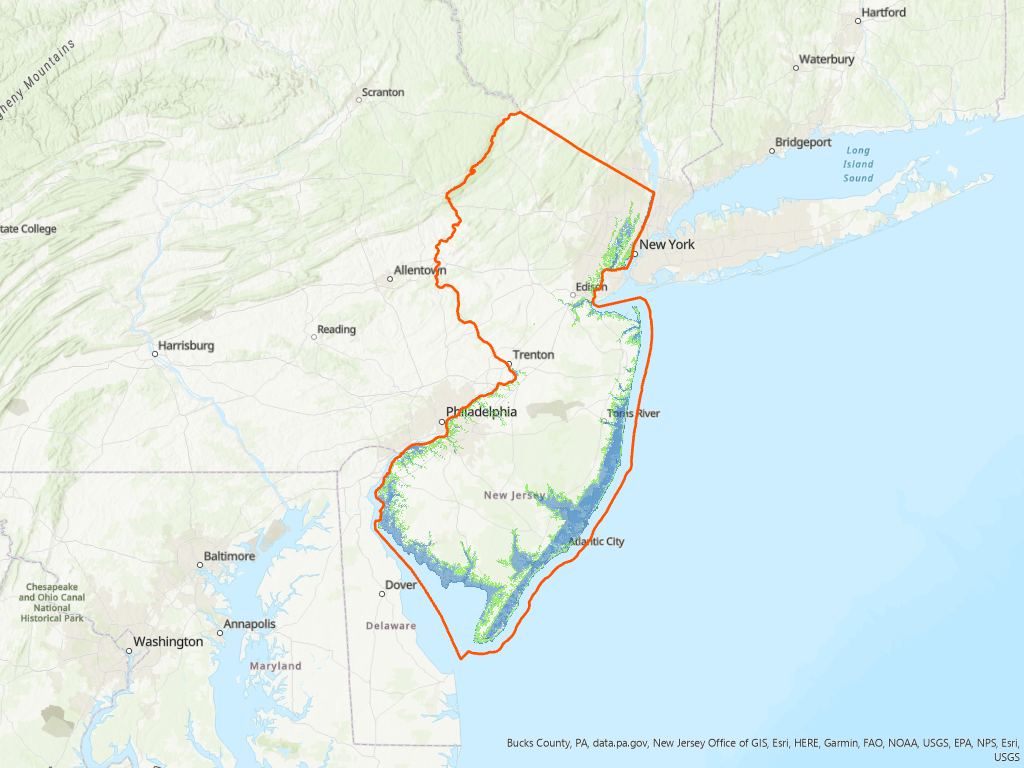
Legend
NJ Political Boundaries
Hospitals
Nursing Homes
Known Contaminated Sites
Cleanups - Sites
Map Symbol Code
FEMA Flood Zones
Flood Hazard Areas
New Jersey: Built Infrastructure Assets Exposure Snapshot
Appendix: Background Information Regarding the Total Water Level Approach
This Appendix provides additional background on sea-level rise and the Total Water Level approach for assessing vulnerability of people, places, and assets in New Jersey to sea-level rise and sea-level rise combined with storm events.
Sea level Rise and Total Water Level: From 1911 to 2019, the mean sea-level rose 1.5 feet along the New Jersey coast, compared to a 0.6 feet rise in the global mean sea-level. New Jersey coastal areas are likely to experience sea-level rise of 0.5 to 1.1 feet between 2000 and 2030, and 0.9 to 2.1 feet between 2000 and 2050.

Figure A-1. Total Water Level reflecting combined inundation from future sea-level rise and flood events.
The number of days that New Jersey residents have experienced high-tide floods has also increased. From 2007 through 2016, there was an average of 8 high-tide flood events in Atlantic City each year. Based on the likely range of sea-level rise projections, Atlantic City will experience 17-75 days of expected high-tide flooding per year in 2030, and 45-255 days per year of expected high-tide flooding in 2050.
For the purposes of the exposure snapshots, different flood events are defined by total water levels (TWLs). TWLs present a height above high tide (See Figure A-1) that reflects the combined inundation from future sea-level rise and current flood events projected into the future from the year 2000 (Kopp et al., 2019).
Flood events1 can occur from surge created by a coastal storm (such as a hurricane or nor’easter) or from high tide each day as sea levels rise. For example, a 2-foot flood event along the New Jersey coast today can occur because of seasonal ‘high-tide flood’ conditions. By 2050, the same 2-foot flood events will become more frequent, occurring under normal high-tide conditions and inundating the affected areas2. While flood events resulting from daily tides will result in permanent inundation (i.e., the water will not recede), coastal storm induced flood events last only for the duration of a storm. A 7-foot flood event along the New Jersey coast that approximates potential hurricane storm tides today will become more likely in the future as coastal storm surge occurs on top of an increased baseline of sea-level to create higher storm tides. You can use our tools at (NJADAPT / NJFLOODMAPPER) to develop custom water levels for your region.
1Flood events referenced in this document as examples reflect ‘total water level’ heights above Year 2000 Mean Higher High Water, consistent with the sea-level baseline datum. See Kopp et al., 2019.
2See Kopp et al., 2019 Appendix B for region specific high-tide flood frequency projections.
Metadata / Sources - Flood Hazards
| Where to Get It | |||
|---|---|---|---|
| Name | Description | Map Service | Authoritative Source |
| FEMA Flood Zones | This FIRM data service allows users to view FIRMs for NJ. Counties were combined using the data downloaded from FEMA's Region II office. | FEMA Flood Zones Map Service | Federal Emergency Management Agency(FEMA) |
| Total Water Level (0 - 20 ft) | This dataset illustrates the scale of potential flooding, not the exact location, and does not account for erosion, subsidence, or future construction. Inundation is shown as it would appear during the highest high tides (excludes wind driven tides). The dataset should be used only as a screening-level tool for management decisions. As with all remotely sensed data, all features should be verified with a site visit. | Total Water Level Map Service | |
| Sea Level Rise (0 - 10 ft.) | This dataset was created as part of the National Oceanic and Atmospheric Administration Office for Coastal Management's efforts to depict potential sea level rise and its associated impacts on the nation's coastal areas. The purpose of the mapping viewer is to provide coastal managers and scientists with a preliminary look at sea level rise and coastal flooding impacts. The purpose of this dataset is to show potential sea level rise inundation above current Mean Higher High Water (MHHW) for the area.This dataset illustrates the scale of potential flooding, not the exact location, and does not account for erosion, subsidence, or future construction. Inundation is shown as it would appear during the highest high tides (excludes wind driven tides) with the sea level rise amount. The dataset should be used only as a screening-level tool for management decisions. | Sea Level Rise Map Services | NOAA Office for Coastal Management |
| SLR Mapping Confidence (0 - 10 ft.) | Inundation Uncertainty Associated with Elevation Data and Tidal Datum Conversion for Sea Level Rise. The purpose of this dataset is to depict errors that are directly related to elevation and water height data. These errors can be used to begin defining areas with mapped inundation that do not have the same level of confidence as other areas. For a detailed explanation of mapping methods, see https://meridian.allenpress.com/jcr/article-abstract/30/3/548/202407/Mapping-and-Portraying-Inundation-Uncertainty-of?redirectedFrom=fulltext | SLR Mapping Confidence Map Services | NOAA Office for Coastal Management |
Metadata / Sources - Health Related Sites
| Where to Get It | |||
|---|---|---|---|
| Name | Description | Map Service | Authoritative Source |
| Hospitals | This feature class/shape file contains locations of Hospitals for 50 US states, Washington D.C., US territories of Puerto Rico, Guam, American Samoa, Northern Mariana Islands, Palau, and Virgin Islands. The dataset only includes hospital facilities based on data acquired from various state departments or federal sources which has been referenced in the SOURCE field. Hospital facilities which do not occur in these sources will be not present in the database. The database does not contain nursing homes or health centers. Hospitals have been categorized into children, chronic disease, critical access, general acute care, long term care, military, psychiatric, rehabilitation, special, and women based on the range of the available values from the various sources after removing similarities. | Hospitals Map Service | Office of Homeland Security - Homeland Infrastructure Foundation-Level Data (HIFLD) Working Group |
| Nursing Home/Assisted Care Facilities | The Nursing Home / Assisted Care feature class/shape file contains facilities that house elderly adults. This feature class’s/shape file’s attribution contains physical and demographic information for facilities in the continental United States and some of its territories. The purpose of this feature class/shape file is to provide accurate locations for high concentrations of elderly adults in the event of a disaster. The attribution within this feature class/shape file was populated via open source methodologies of authoritative sources. During the update cycle for this deliverable, there were 6010 records added. | Nursing Home/Assisted Care Facilities Map Service | Office of Homeland Security - Homeland Infrastructure Foundation-Level Data (HIFLD) Working Group |
Metadata / Sources - Environmental Hazards
| Where to Get It | |||
|---|---|---|---|
| Name | Description | Map Service | Authoritative Source |
| Known Contaminated Sites List | This dataset is updated daily. The Known Contaminated Sites List (KCSNJ) for New Jersey are those sites and properties within the state where contamination of soil or ground water has been confirmed at levels equal to or greater than applicable standards. This list of Known Contaminated Sites may include sites where remediation is either currently under way, required but not yet initiated or has been completed. | Known Contaminated Sites List Map Service | New Jersey Office of Strategy Management - NJEMS |
| EPA Cleanup Sites | Accidents, spills, leaks, and past improper disposal and handling of hazardous materials and wastes have resulted in tens of thousands of sites across our country that have contaminated our land, water (groundwater and surface water), and air (indoor and outdoor). EPA and its state and territorial partners have developed a variety of cleanup programs to assess and, where necessary, clean up these contaminated sites. CIMC (www.epa.gov/cimc) brings together the data from many of these cleanup programs and lets people map, list and access cleanup progress profiles for sites across the US so that people can know what is going on in their communities. | EPA Cleanup Sites Map Service | United States Environmental Protection Agency |